
The FTSE index was one of the strongest indexes throughout the passing week, and the volatility created was really remarkable. Monday was bearish to test the Low of the bearish move of the Brexit vote, hardly reached half the way down, and then very bullish 4 days without looking backward.
Last review I mentioned that the Market is most likely going to trade sideways. Eventually the market was much stronger proven me wrong. Yet, after this kind of price action we’ve been through since the beginning of May, there are still many chances to see a reaction back into the mid range at the 6150-6200 level area, prior to any real long term bullish move (if/when).
The passing week included the closing of three important bars – the Monthly, the Quarterly and the Semiannual bars. All three ended bullishly, closed on their Highs, way above the short term sentiment 8 EMA line for each respective timeframe. They even got a confirmation by making an immediate HH right at the start of the new Monthly, Quarterly and Semiannual bars.
The monthly bar closed as a big Bullish pinbar, with an amplitude pointing to a new all time high, the 7200 area, above the 6950 level that served as an upper barrier for the market since year 1999, and above it’s false breakup at the beginning of year 2015. The stop for that move is below the Monthly bar, at 5788. Of course it is not practical for trading directly, although it can help us in terms of lower timeframe signal validations. However, there is still a valid bearish setup potential created with the false breakup of the big 16 year range, so we might need much more time to understand the longer term intentions of the market.
The current momentum up has two very strong resistance levels. The First one is the Monthly LLBH (Last Low Before High) at 6693.8, the same move that started the 15 year false breakout. the second is the next High to conquer, at 6764.8. These two levels are very tough resistance, and if the market continues the current bullish momentum, one of them might trigger a big reaction down, probably into the mid range explained before.
On the bearish side, expect currently no more than declining into the mid range. Strong support at the Monthly LHBL at 6487.9, the Weekly 200 SMA line currently at 6460, the 6322 to 6380 level area, and the 6150 to 6250 level area.
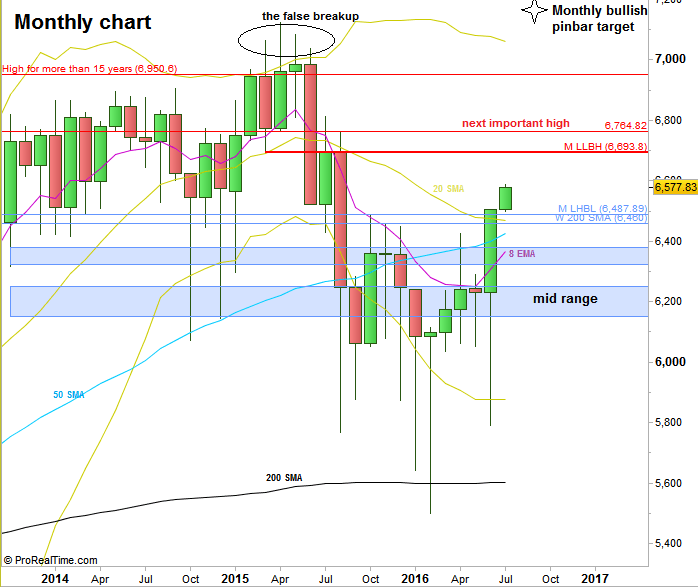
FTSE Futures, Monthly chart (at the courtesy of prorealtime.com)
Disclaimer: Anyone who takes action by this article does it at his own risk and understanding, and the writer won’t have any liability for any damages caused by this action.