
Days before the Brexit poll, The FTSE100 entered a bearish setup in the passing week by breaking down the 6050.21 level.
As mentioned in the previous review, the target for this setup is at the 5800 level area. This area is also the Monthly and Weekly lower Bollinger Bands, and a major Daily support level lies 5 points below it, at 5795. This setup is valid as long as the high of the upthrust at 6322.6 made on the week before is still being respected.
A good opportunity to join this bearish setup can emerge if the market corrects higher into the 6109-6150-6170 area of Daily resistance levels, and shows a sign of weakness, like a Daily bearish pinbar (or Daily bearish engulfing pattern) -followed by a thrust down the next day. This thrust down, if happens, can be a good bearish opportunity to ride the downtrend into the 5800 area target.
In case you like to take a counter trend trade by expecting a probable pullback into the resistance levels described above, it is better to take it only is there another leg down before (Daily bearish bar) that doesn’t reach (!) the Daily lower Bollinger Band. Buying the break above the High created (currently at 6046.1) only if the distance to the next resistance level in compare with the correct Stop Loss level justifies a trade.
Has the market reached the 5180 level area, further signs of weakness with or without a pullback, can take the price lower to the Quarterly 50 SMA. Currently for this Quarter, it is at 5720, closed to a Daily support level as well.
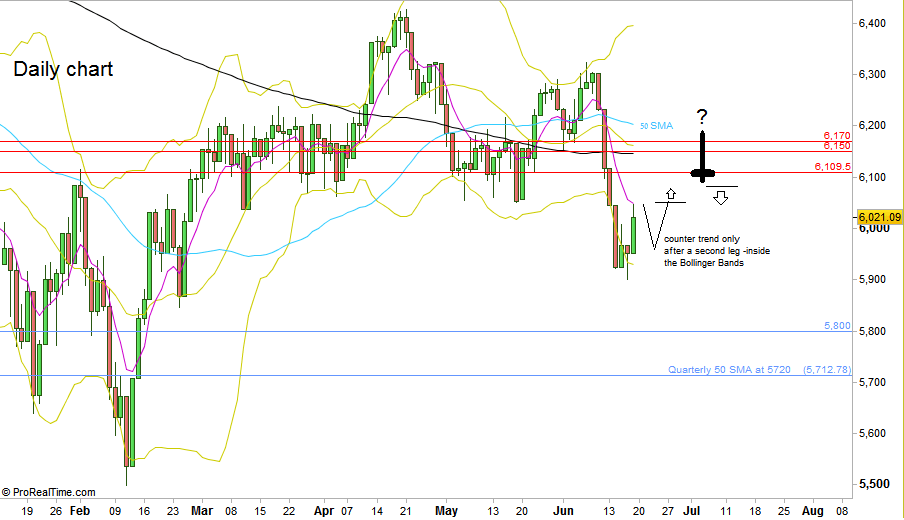
FTSE Futures – Daily chart (at the courtesy of prorealtime.com)
Disclaimer: Anyone who takes action by this article does it at his own risk and understanding, and the writer won’t have any liability for any damages caused by this action.