
The FTSE100 was one of the strongest markets throughout the passing week, printing a HH HL Weekly bar closing on its High. Finally the Weekly swing High at 7067.34 was taken out, and the Monthly bar, 4 days before closing is printing a convincing reversal up.
Last Monday the market gave a good signal as for the following days by making a false thrust down on the Daily timeframe, closing as a bullish pinbar (This type of behavior is called a Spring). The target of 1:1 has been reached three days later. Pay attention to the same “Spring” behavior on last Thursday, a false thrust down ending strong as a bullish pinbar, already triggered by the thrust up on last Friday. The target is at the 7107 level, closed to the upper Weekly Bollinger band. Before that we have the Daily engulfing pattern of December 15th, printing towards 7095, the same as the target of the last Tuesday’s bullish pinbar.
The next major target is the 7220 level, being pointed by the previous Weekly pinbar on sloping 8 EMA and the pinbar of the month of June (the Brexit), with the same range as the 2016 2nd Quarter’s pinbar, and the 7250 level target of the last Weekly follow through model mentioned couple of times in the past reviews. I wouldn’t suggest using the same Daily stop for that target in case of reaching the 7107 target on the Daily signal mentioned above, as the market might react sharply before continuing higher.
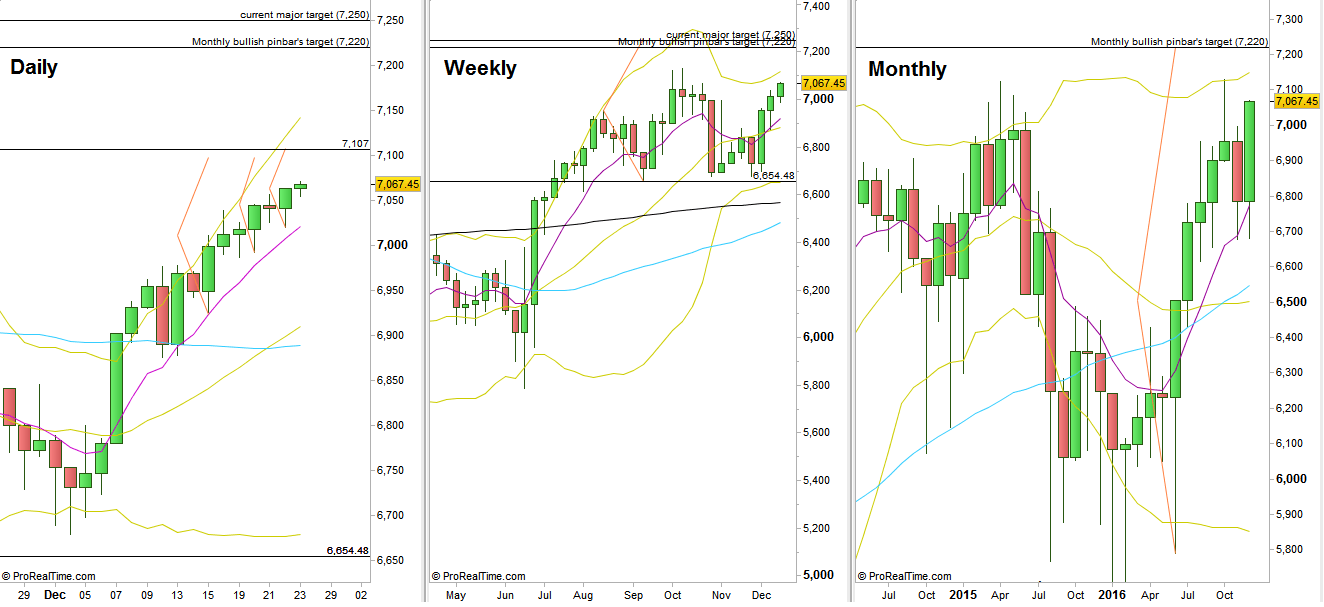
FTSE Futures, Daily, Weekly and Monthly charts (at the courtesy of prorealtime.com)
Disclaimer: Anyone who takes action by this article does it at his own risk and understanding, and the writer won’t have any liability for any damages caused by this action.