
Like in the previous week, in the passing week the FTSE100 was one of the strongest stock markets, printing a HH HL Weekly bar closing on its High.
The Monthly bar has indicated a very convincing reversal up, as well as the Yearly bar has done.
The most important picture is the Yearly picture. Being in a 17 year range, after a false thrust up the previous year, a very strong and convincing reversal took place with a bar which is an OKR, and engulfing pattern, and a Spring (false thrust down) meaning one thing: I am very strong. On a thrust up above the High in the year 2017, don’t expect the coming year to pass without a considerable thrust up. the Yearly reversal bar points towards the 8700 area as a target (but the stop for this signal is below its Low at 5499).
The most important target around is the 7220 level, being pointed by the Weekly pinbar on sloping 8 EMA three weeks ago, and the pinbar of the month of June (the Brexit), with the same range as the 2016 2nd Quarter’s pinbar. Above it, there is the 7250 level target of the last Weekly follow through model mentioned couple of times in the past reviews.
Later on, there is the 7500 level target for the Semiannual bullish pinbar made on the first half of 2016, and the last Quarter of 2016 ended as a bullish pinbar on sloping 8 EMA, pointing to 7580 as its target – in case of taking out its High.
This time, lets have a look on the higher timeframes. Happy New Year !
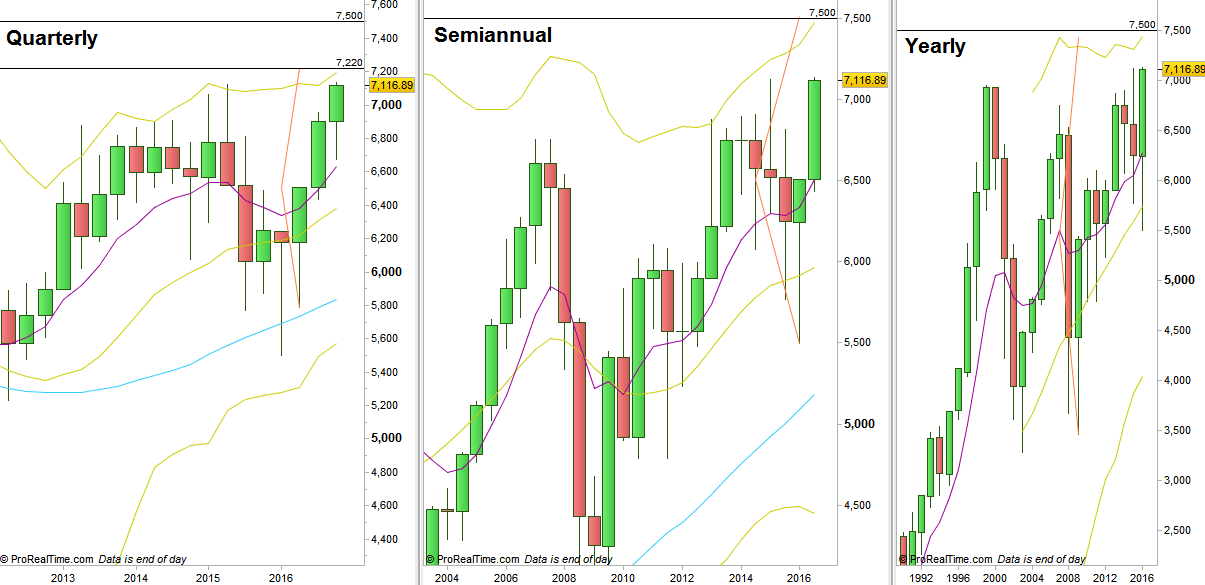
FTSE, Quarterly, Semiannual and Yearly charts (at the courtesy of prorealtime.com)
Disclaimer: Anyone who takes action by this article does it at his own risk and understanding, and the writer won’t have any liability for any damages caused by this action.