
The last two volatile price action weeks gave way to a narrow range consolidation week, the whole week as an inside price action within the range of the previous Friday (!)
Being within an inner Daily bar environment, currently quite at the mid range, any signal on the 8H and above might be very misleading. In such cases, good opportunities within these timeframes may present themselves only at the edges, e.g. a false thrust down that takes out the Weekly Low but ends up as a sign of strength.
The most important point to pay attention at the moment is the Low at 6654.48. Taking out this Low is a major sign of weakness, and may lead to midterm bearish sentiment, probably at least towards the Weekly 50 SMA area, currently at 6400. Respecting this Low means that the current bullish target at 7250 is still in play, slightly above the last June Monthly pinbar’s target, at 7220.
By looking at the bigger timeframes like the Semiannual and Yearly charts, there are much more chances to see a midterm bullish sentiment developed from here, but the current indecisive behavior may last another month and a half, i.e. till the next semiannual bar is under way.
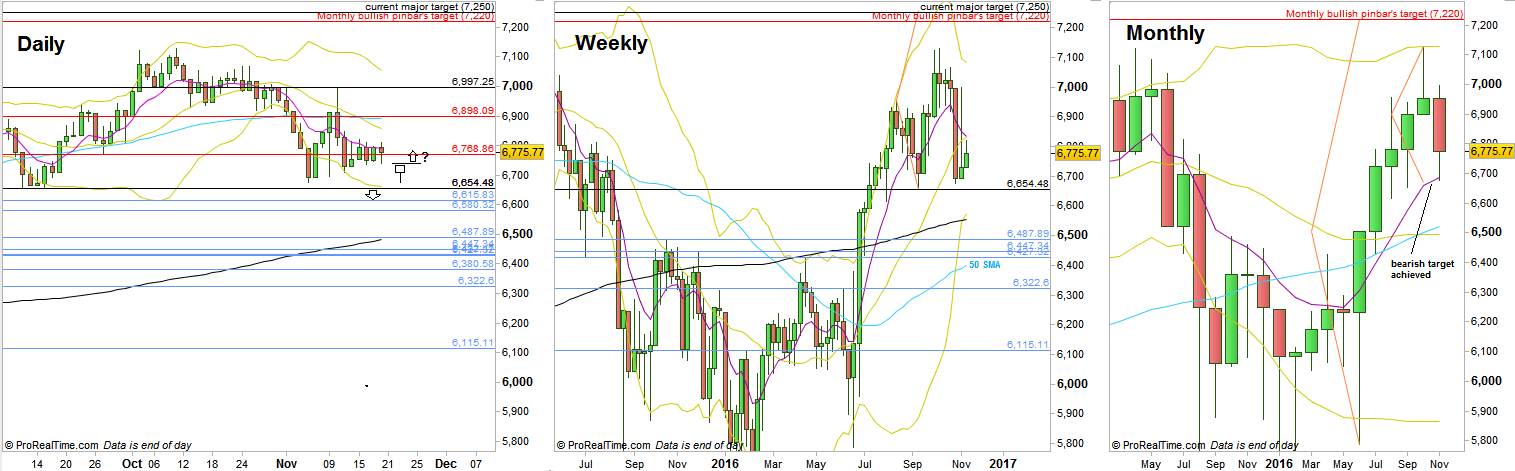
FTSE Futures, Daily, Weekly and Monthly charts (at the courtesy of prorealtime.com)
Disclaimer: Anyone who takes action by this article does it at his own risk and understanding, and the writer won’t have any liability for any damages caused by this action.