
We haven’t seen such a volatile Weekly bar since the post Brexit days. The Month of October ended as a bearish pinbar on the upper Bollinger band, and a thrust down made on last Wednesday signaled a bearish move of the same magnitude. Prices almost reached the exact magnitude target, practically we may say that the market did achieve it.
Taking out the Weekly swing Low at 6654.48 is a bearish signal to reach the mid range of the Brexit bar, approximately at 6200. The same bearish momentum should reach first the 6580 area prior to any major pullback. On the way down, there is a very strong support on a relatively big range – all the way down from 6580 to 6320, and I doubt not to see a major corrective rally before, one that eventually can turn the picture from bearish to bullish one on the longer term.
Currently we are at a clear support, the Monthly 8 EMA. It shouldn’t be surprising to see the market respects the Weekly swing Low, reversing back to 6880-6890 before possible another attempt to go down later on.
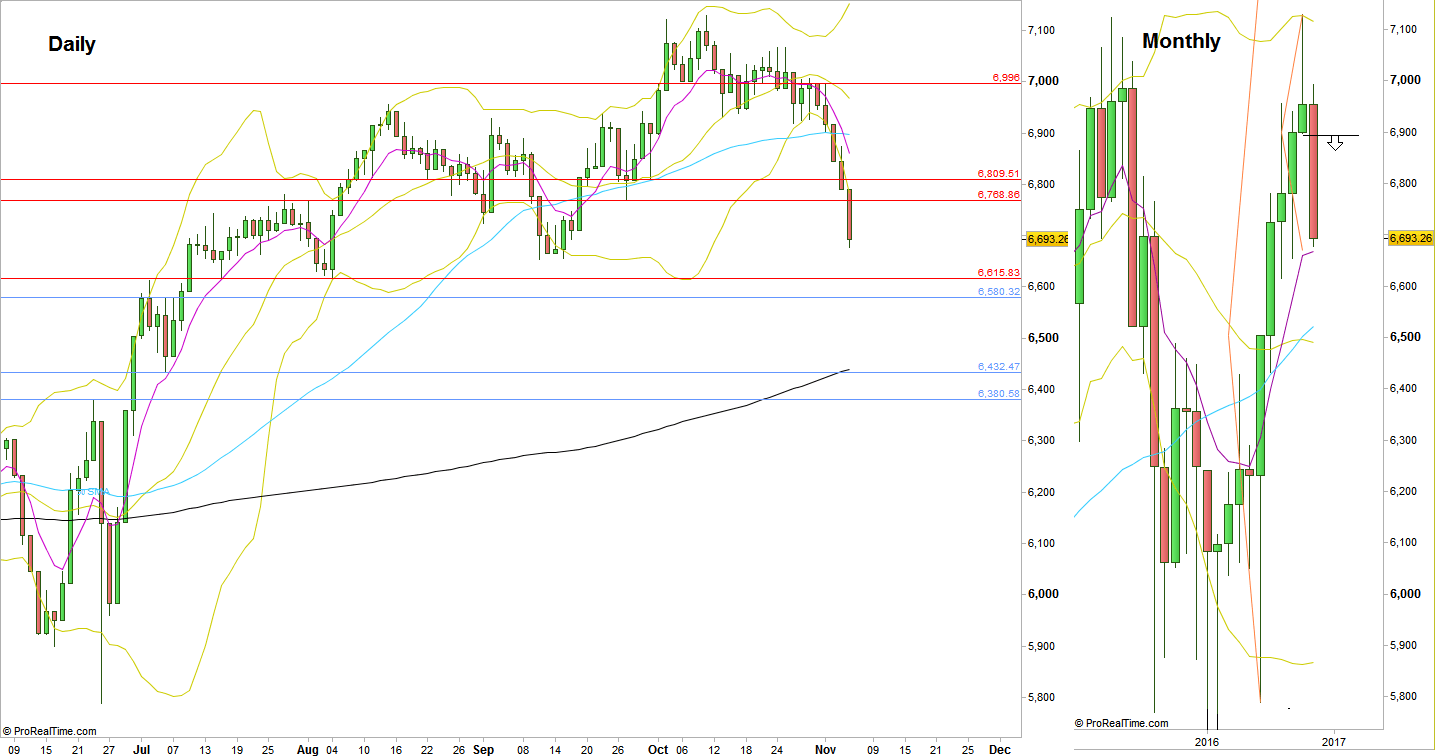
FTSE, Daily and Monthly charts (at the courtesy of prorealtime.com)
Disclaimer: Anyone who takes action by this article does it at his own risk and understanding, and the writer won’t have any liability for any damages caused by this action.