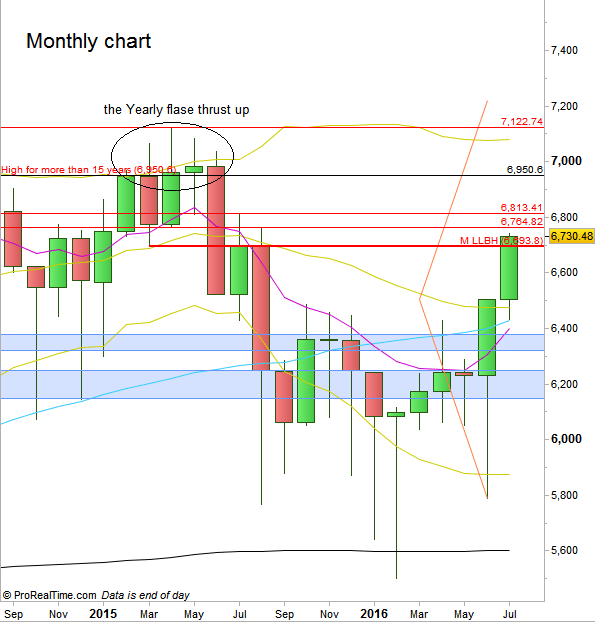
The passing week ended as a narrow range Weekly inner bar, right on the important resistance at 6693.8, the Monthly LLBH prior to a 15 Year range false breakup (so far). Here is a reminder as of the Yearly chart:
The Monthly chart shows the picture more clearly.
The coming week may reveal what the market is planning ahead.
On a thrust up above the Weekly High, by most chances the next level at 6764.8 (the High of August 2015) is going to be taken out. The real question comes next, as slightly above, there is an important retracement level from the High of year 2015 to the Low of year 2016 (6775.4, 78.6%). Respecting this level means that the market is not that bullish currently, and might be ready for a correction down.
The coming Weekly bar is going to close with important information: Closing July above (strong) or below the Monthly resistance at 6693.8.
Disclaimer: Anyone who takes action by this article does it at his own risk and understanding, and the writer won’t have any liability for any damages caused by this action.


