During the passing week, the FTSE100 has still been trying to find a direction, and as mentioned on the last review, there wasn’t any good swing setup. So goes for the coming week.
The fact that the last weekly bar, after extending the range of the previous Weekly bar, closed like the latter, in the middle, -calls for further sideways action. Don’t be surprised to have even two more weeks of sideways action.
We should be very cautious with any Weekly bar break to either direction. Most chances in a case of a Weekly break are for the prices to reverse eventually back into the Weekly range rather than developing into a real Daily/Weekly trendy move.
By the price structure of the last 15 Weekly bars, there are more chances to see a false Weekly break up – rather than a false break down.
By false break I don’t mean necessarily a break of few ticks and then reversing back, but a break that won’t succeed in initiating a good Daily swing, at least.
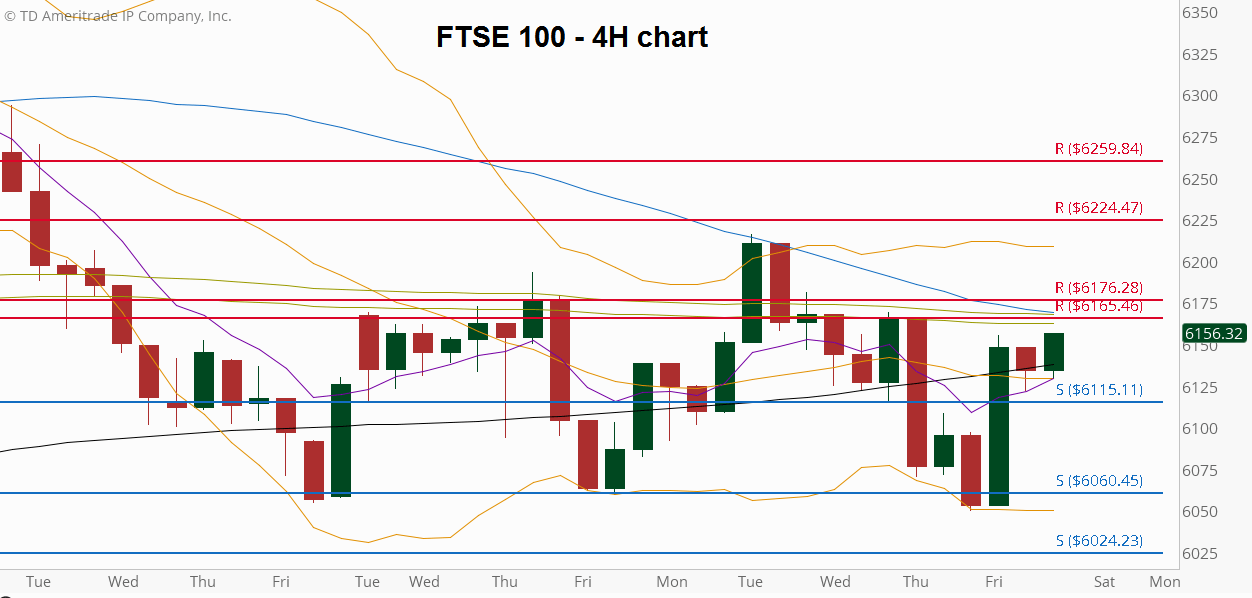
Since the most chances are for sideways action, here is the 4H chart of the FTSE100, with near term Support/Resistance levels for the 4 Hour timeframe.

FTSE100 – 4H Chart with main 4H support/resistance levels
Tue May 3rd till Fri May 20th 2016
(at the courtesy of ThinkorSwim)
Disclaimer: Anyone who takes action by this article does it at his own risk and understanding, and the writer won’t have any liability for any damages caused by this action.
