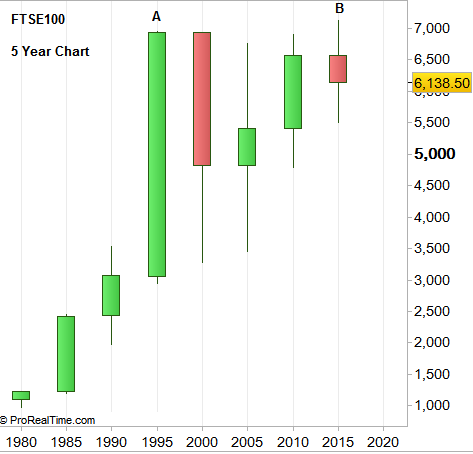
Before we dig into the FTSE100 short term price action in the following weeks, let’s start by having a very wide range picture to show as where we are strategically. Chart1 is the 5 year chart of the FTSE100, i.e. each bar lasts 5 years. The years 1995-1999 printed a very bullish wide range bar (A) with all time high at 6950 (Dec 1999), held for about 15 years. Only the current bar that has started since 2015 (B) took out that high and finally managed to get out of the huge range of bar A.
This first thrust above the high of 6950 hasn’t done well so far. Two Quarters of false breakout caused the FTSE100 to reverse towards the mid range, a typical behavior in false breaks. However, we shouldn’t forget the correct timeframe perspective, and it is still very early to state an opinion as for the next mega move, i.e. resolving this current huge range.
By the Quarterly chart, there are good chances to stay in the current big range of 5500 to 7000 for at least 14 more months (more accurately, the end of the first semiannual bar of 2017, end of June 2017), in which the way it behaves in testing the 6500-7000 level may give some clue as for resolving the big 20 year range.
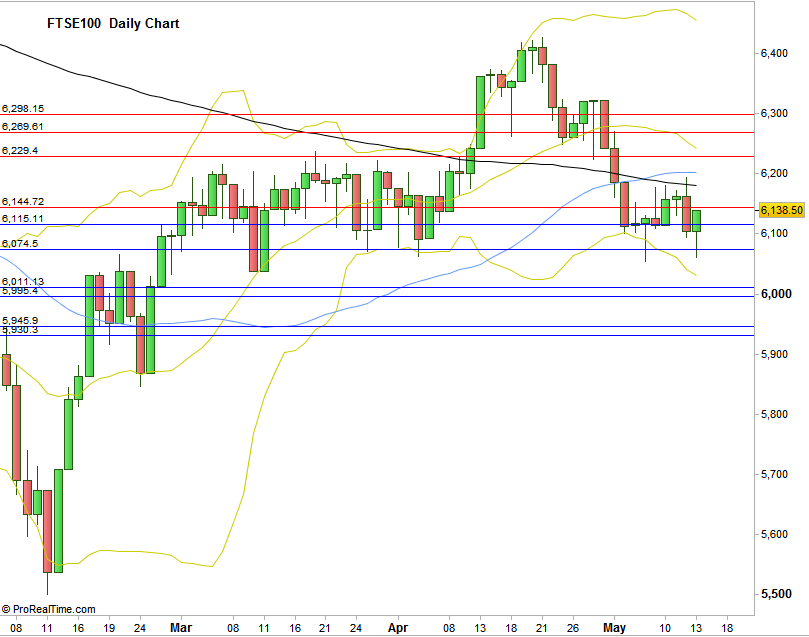
Currently on the short term, the Weekly and the Daily timeframes, there isn’t any clear setup for either direction, and we probably be spending more time inside the range the month of May has been creating.
Chart2 is the daily chart, with major support (blue) and resistance (red) line levels to pay attention to. Bollinger Bands of (20,2) are listed in yellow, the 50SMA in magenta and the 200 SMA in black.
Disclaimer: Anyone who takes action by this article does it at his own risk and understanding, and the writer won’t have any liability for any damages caused by this action.


