
The passing week ended as an inside bar, still respecting the most important Low around, the Low of February at 7093.5, which is the Monthly last Low before the High.
The Monthly bar of April closed finally above the 8 EMA short term sentiment line, with clear sign of weakness. It never touched the upper Bollinger band as its successors, and in addition by looking at that bar there isn’t an expected sign of strength as it would have been in a bullish Pinbar on sloping 8 EMA. It was very closely, has the market kept the Weekly High levels during last Thursday and Friday, it would have been a Monthly bullish Pinbar on sloping 8 EMA.
Currently the important Low is the current Monthly Low (of April) at 7096.8.
Taking out this Low is a bearish setup to decline to the 6870 level area. This is not a qualitative signal, and in case it triggers, take into an account possible deep corrections up along the way.
On the other hand, taking out the Weekly High is a bullish signal to reach the Monthly High at 7406.3, which is in this case it is highly important to track whether the Monthly High is taken out or not.
Combining the above together, I see many chances for the market to print another inside Weekly bar in the coming week .
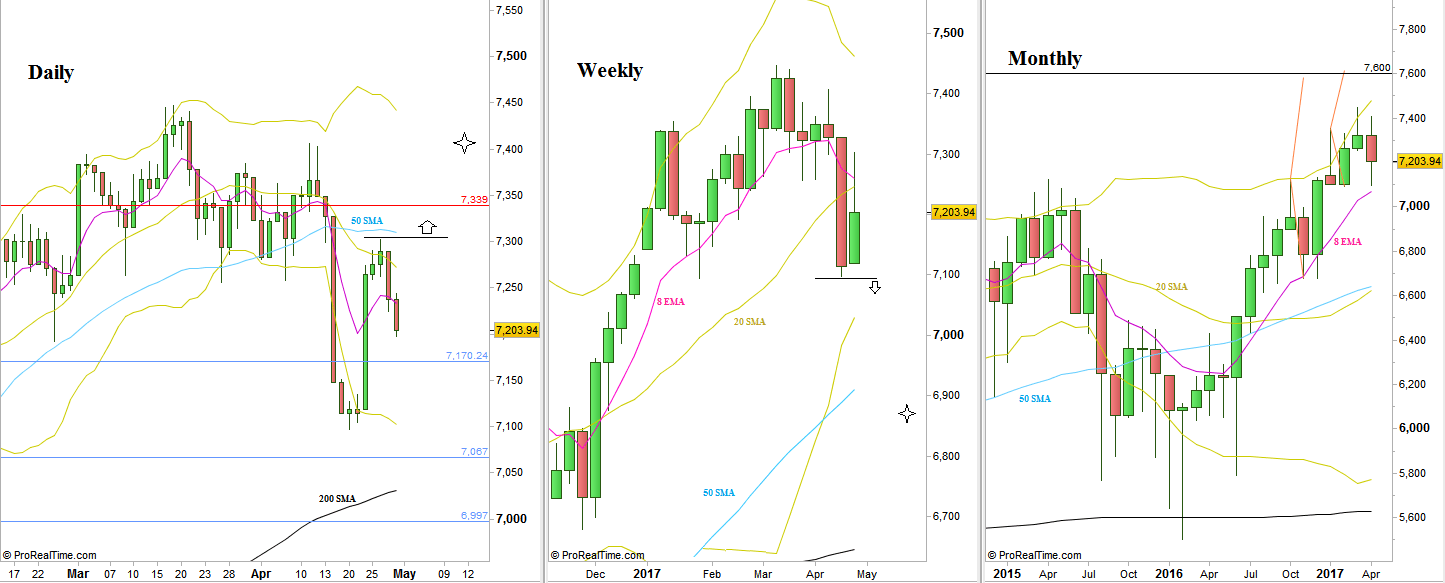
FTSE100: Daily, Weekly and Monthly charts (at the courtesy of prorealtime.com)
Disclaimer: Anyone who takes action by this article does it at his own risk and understanding, and the writer won’t have any liability for any damages caused by this action.