
Except for last Monday, the rest of passing week was bearish, starting with a Daily Upthrust (false thrust up) above Monday’s High turning into a relatively strong supply down to 7300.
But even that won’t make the Weekly closing below the 8 EMA short term sentiment line, a clear sign of strength. On the other hand, the market is not enthusiastic to go up either as the Weekly climbs but doesn’t stick to the upper Bollinger band. This kind of linear crawling price action is an aberration that the market won’t be able to keep for long, and a change of behavior by a sharp move is very likely to come soon.
Taking out the Weekly Low at 7301.8 is a bearish setup to reach the 7250 level, but it is not a recommended trade idea (as a Swing), and by most chances in case of taking out the Weekly Low are to have a false breakdown that might test the Daily 50 SMA and Daily lower Bollinger band, penetrating the Weekly 8 EMA turning into a Spring. This is true as long as the market respects the previous Daily Swing major Low, at 7263.6. Otherwise, if that Low is taken out, then the 7250 level should most likely be reached.
The main targets of the market above are the 7470 (in case the 7263.6 level remains respected) for the Weekly pinbars on sloping 8 EMA, the 7500 level being pointed at by the 2016 first half Semiannual Pinbar on sloping 8 EMA, and the 7570 area that both a major Monthly follow through model points at, as well as the Monthly Spring (false thrust down reversal) of last February.
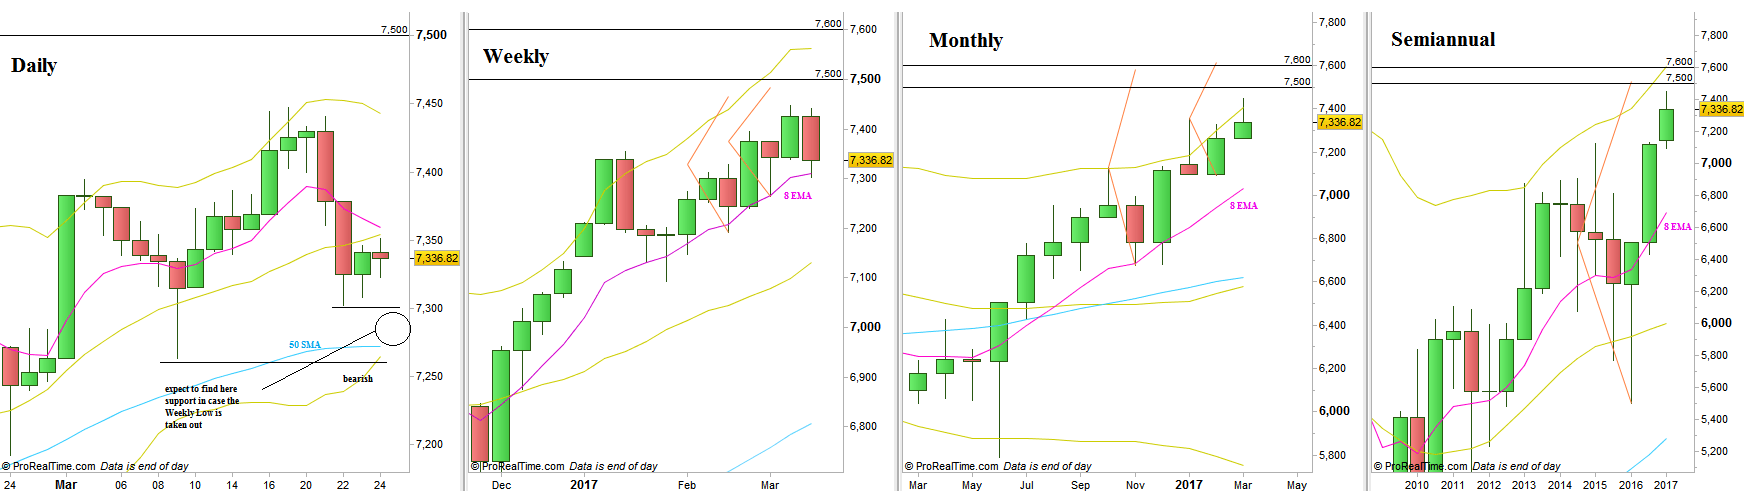
FTSE100, various timeframe charts (at the courtesy of prorealtime.com)
Disclaimer: Anyone who takes action by this article does it at his own risk and understanding, and the writer won’t have any liability for any damages caused by this action.