
The thrust up above the previous Friday’s bullish pinbar ended as a false thrust up, before a clear signs of weakness for the rest of the week, finally ending the whole week as a bearish OKR. This was an important indication where the market could take out the all time High and demonstrate strength for the longer term, but instead has reversed down.
So, the Monthly bar is still respecting the LL LH behavior, and the Monthly bar might close weaker. The Weekly swing Low is very likely to get tested again, and if happens on the last two days remaining for February to close, may turn the Monthly bar closing weak like last January’s bar.
However, the longer term is still very bullish, and the fact that the last two Monthly bars penetrated the upper Bollinger band, and so did the Quarterly bar, should prevent us from being biased to the bearish side for the longer term. Any Monthly weakness that might follow later on into the month of March, perhaps down to the 7000 levels should be watched for new signs of strength for the longer term bullish behavior continuation.
The Semiannual target (bullish pinbar on sloping 8 EMA for the first half of 2016) is pointing at 7500 and previous Quarterly bar points at 7600.
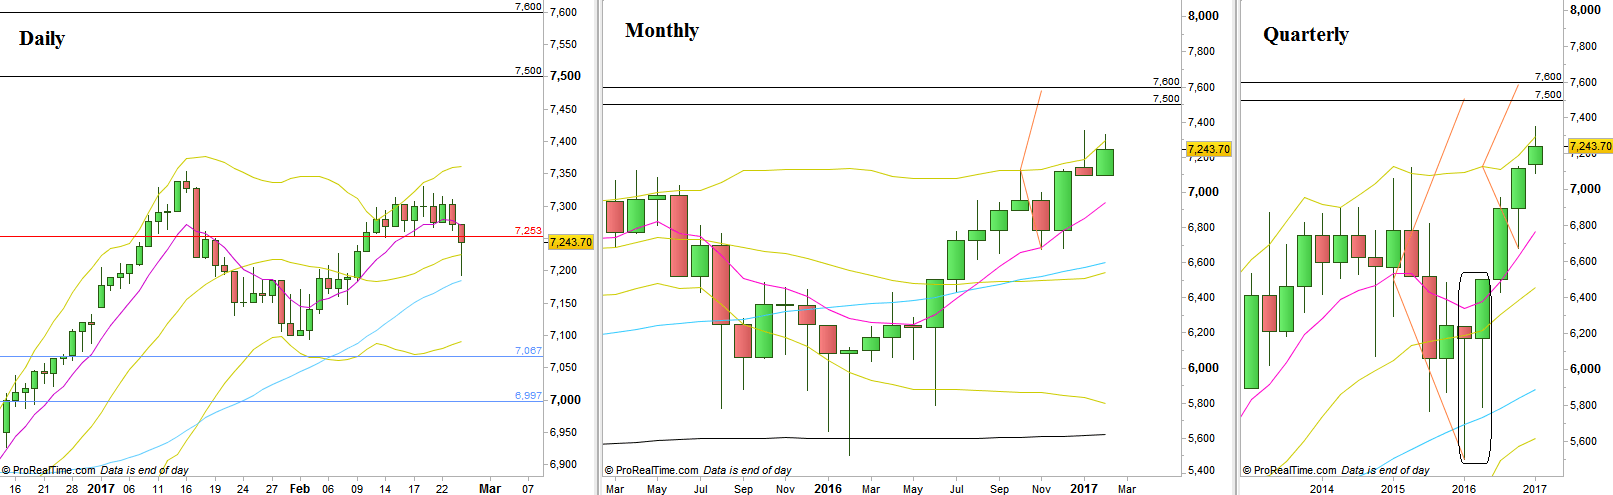
FTSE100, Daily, Monthly and Quarterly charts (at the courtesy of prorealtime.com)
Disclaimer: Anyone who takes action by this article does it at his own risk and understanding, and the writer won’t have any liability for any damages caused by this action.