
The market has reached the target of 7310 mentioned in passed reviews, by printing another bullish weekly bar, with some shortening of the thrust. The market is in a Monthly bullish setup to reach the area of 7600 by a follow through model seen on the Monthly chart.
Last Friday ended as a clear sign of strength. A bullish Daily pinbar on sloping 8 EMA, Which is also a Spring (false thrust down) and an OKR (Outside Key Reversal).
Taking out the High of last Friday is a bullish signal to make a new all time High (at 7360), meaning that the Monthly bar is most likely going to turn into a bullish OKR as well. Pay attention that it is not a usual scenario when the price action is on the highs.
As for higher targets, the 2016 first half Semiannual bullish pinbar on sloping 8 EMA is pointing at 7500, and the last quarter’s Quarterly bullish pinbar on sloping 8 EMA is pointing very closed to 7600 almost the same signal as the Monthly follow through model mentioned above.
On the other hand, respecting Friday’s High and taking out the Weekly Low at 7251.8) is a sign of weakness, that should have another secondary test (again, that respects the highs) prior to going short on the follow through thrust down. The major support for the Daily and Weekly timeframes lies at 7502.
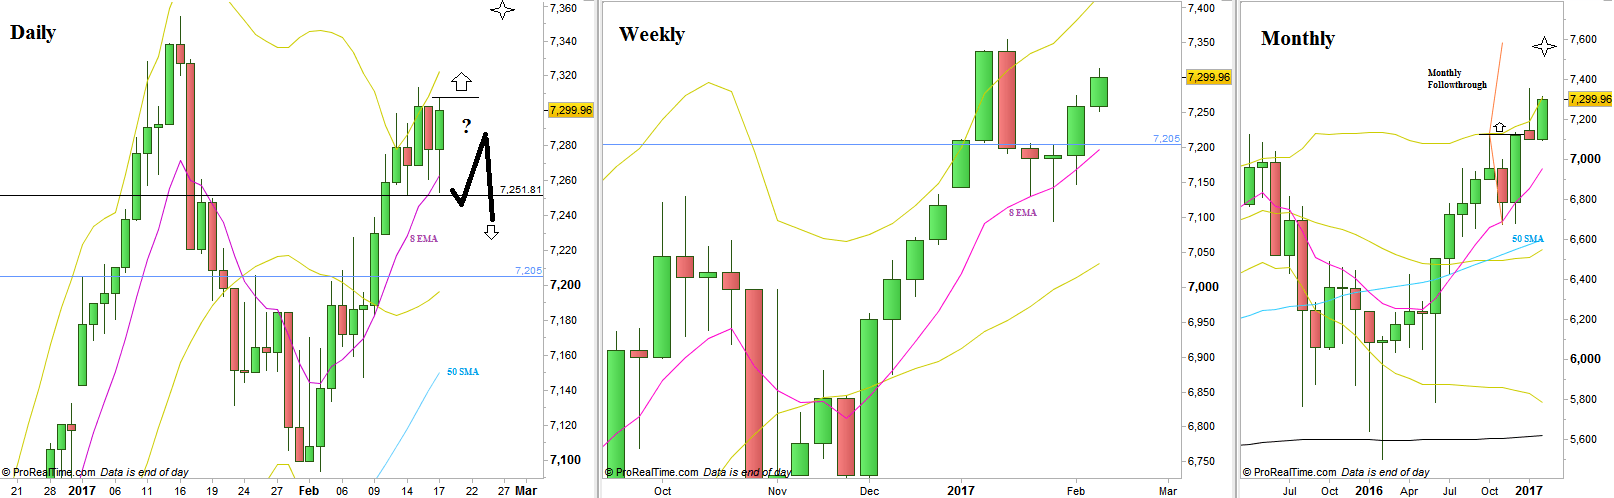
FTSE100: Daily, Weekly and Monthly charts (at the courtesy of prorealtime.com)
Disclaimer: Anyone who takes action by this article does it at his own risk and understanding, and the writer won’t have any liability for any damages caused by this action.