
The previous Weekly bar closed as a bullish pinbar on sloping 8 EMA, and as mentioned in the last review, a thrust above its High is a bullish signal to reach the 7310 area. That thrust came right on last Monday, and after a false thrust down on Wednesday, the move up has eventually started.
The Daily timeframe gives another justification to that target, as the follow through model (see chart) is pointing on the same target level.
Notice that the 7310 level is a strong resistance, as this is the first time for the price to reach again this level that caused the price to decline sharply. So many unfulfilled orders might stop any further advance on the first attempt to make a new all time High.
This caution as for the next bullish move has another cause. Pay attention that the Monthly bar had already made a LL, a fact that might turn any attempt to make a new all time High – right on the current month – to be very difficult.
The next important bullish targets for the long run are the Quarterly and Semiannual bullish pinbars, pointing at the 7500-7600 area, the Semiannual upper Bollinger band.
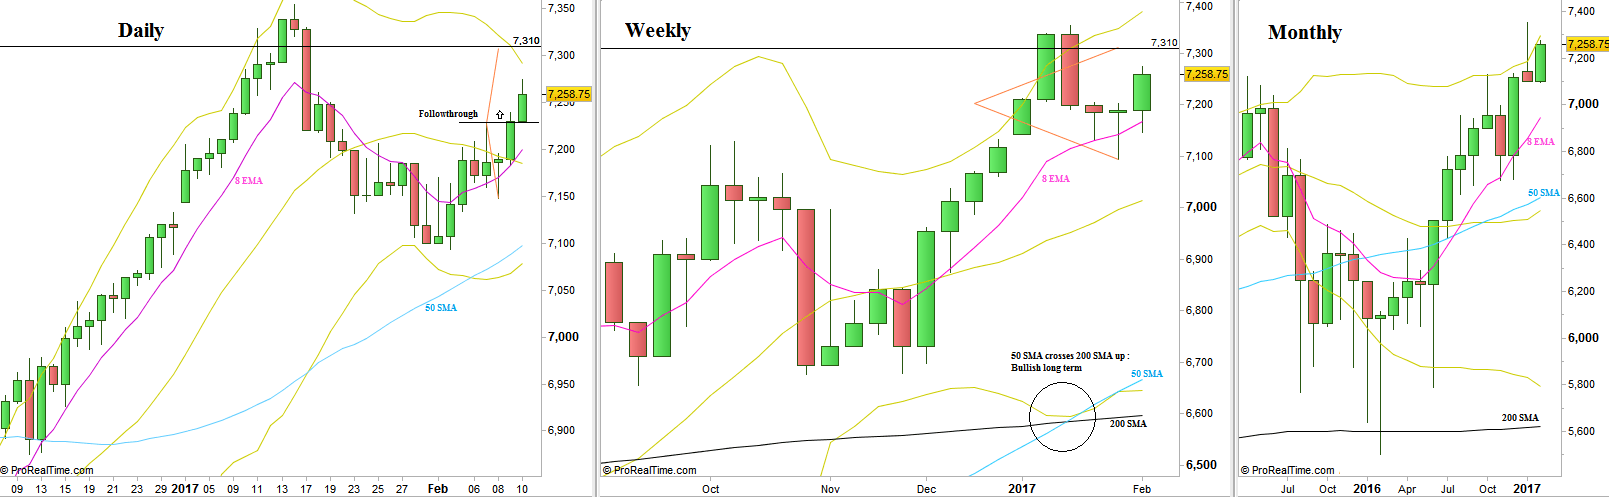
FTSE100, Daily Weekly and Monthly charts (at the courtesy of prorealtime.com)
Disclaimer: Anyone who takes action by this article does it at his own risk and understanding, and the writer won’t have any liability for any damages caused by this action.