
After 6 consecutive clear bullish weeks, achieving the targets mentioned at this area, here came the passing week to make a bearish engulfing pattern, cooling the bullish enthusiasm.
However, pay attention to the strong momentum by the penetration of the upper Bollinger band of the last three Weekly bars. It means that even if the market is bearish, by most chances we should see another test of the highs prior to a real bearish activity.
The attention should currently stay bullish. Only by closing the Monthly bar weak and then a thrust down by the next month, it should alarm that we might see soon lower levels such as the 6900 area.
The next important bullish targets are the Quarterly and Semiannual bullish pinbars, pointing at the 7500-7600 area, at the Semiannual upper Bollinger band.
For the longer term, keep in mind that the Yearly bar of 2016 ended as a bullish pinbar on sloping 8 EMA and a bullish engulfing pattern, after being 17 years in a bullish flag type of range, and already after a false break up (last year). This yearly bar has already gotten a confirmation by taking out its High during the passing week. The potential for the longer term, hence, is huge, at 8700 approximately (not to forget the Stop in this case at the Yearly Low, respectively huge).
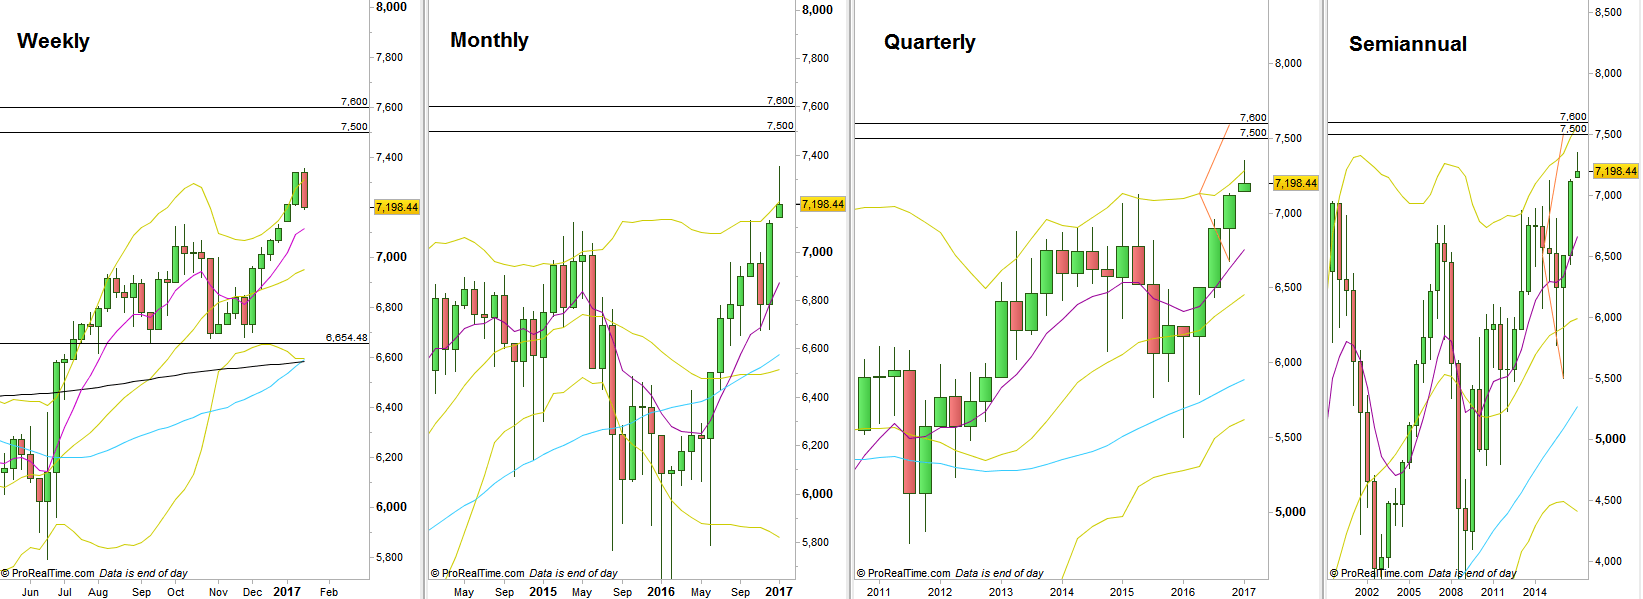
FTSE100, Various timeframes (at the courtesy of prorealtime.com)
Disclaimer: Anyone who takes action by this article does it at his own risk and understanding, and the writer won’t have any liability for any damages caused by this action.