
The FTSE managed to close the Quarter close to its High, pretty strong. The Monthly bar ended as an inside bar, and the Weekly bar managed to make a HH HL bullish pinbar on a sloping 8 EMA.
At first sight the picture looks strong, but this price action may turn out to be very misleading.
The alarming indications are the Monthly bar that although ended bullishly, didn’t manage to take out the Monthly’s High at 6955.34, and the fact that last Thursday’s bar which managed to make a Higher High – failed to touch the Daily upper Bollinger band, immediately followed by a thrust down the next bar (Friday). These indications raise the possibility for a false thrust up eventually.
Currently the market is in a bearish setup to reach and take out the Weekly Low at 6768.86. Stop level is at the High made by last Thursday at 6941.09, but can be set as well above 6919.42. Taking out Friday’s High at 6919.42 is a warning sign that this setup has much less probabilities to work.
If the market does break up, pay attention to the strong resistance levels of 6979, 6995, 7025 and 7044.
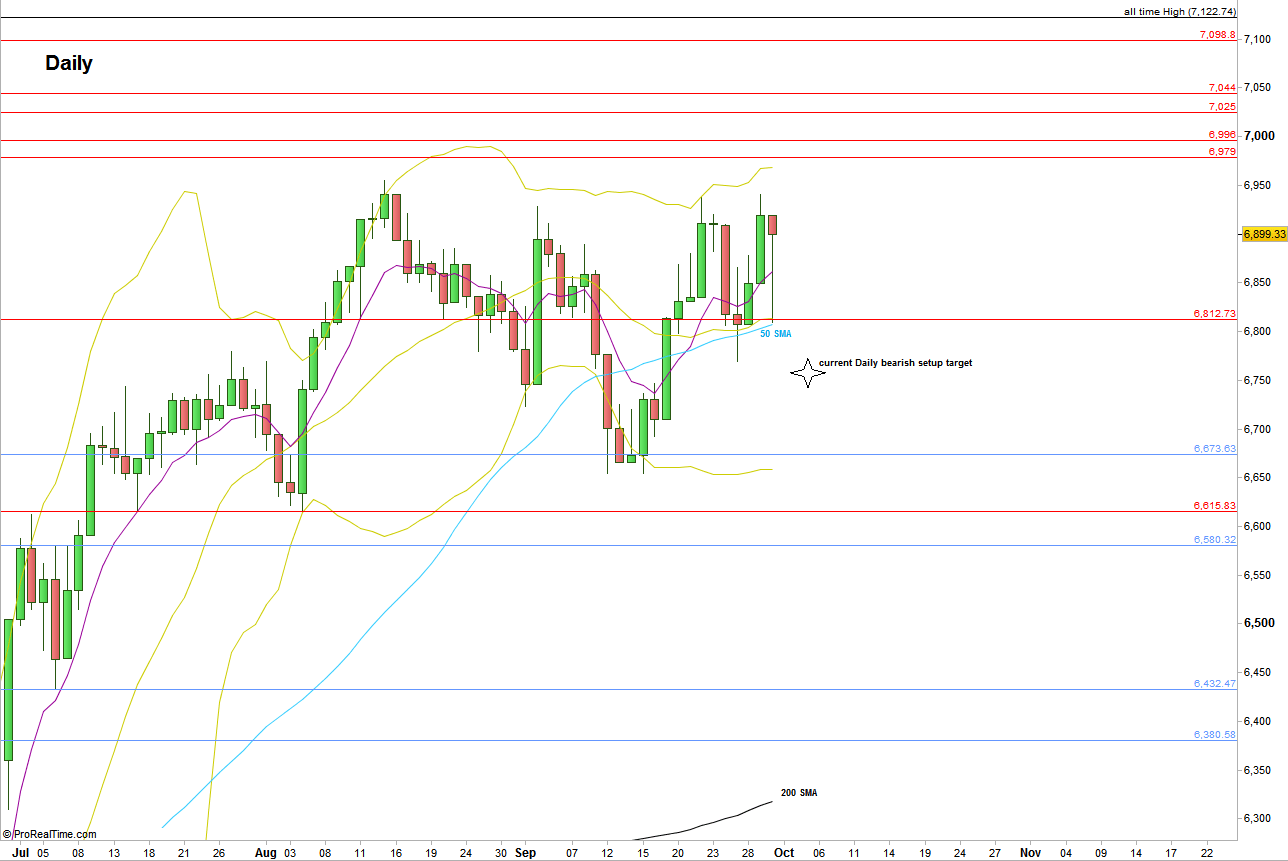
FTSE Futures, Daily chart with main support and resistance lines (at the courtesy of prorealtime.com)
Disclaimer: Anyone who takes action by this article does it at his own risk and understanding, and the writer won’t have any liability for any damages caused by this action.