
The FTSE was one of the strongest indexes throughout the passing week. Technically we can relate some of this strength to the weakness of the GBP, respectively.
The market did print a Daily bearish pinbar on the 6812 resistance level, as suggested in the last review, but it hasn’t been followed by a thrust down, so there hasn’t been any Daily bearish signal throughout the week. More than that, the expected crossing of the Daily 20 SMA down the 50 SMA (bearish sign) has been denied eventually due to this strength the market has demonstrated.
The whole price action of September is still inside to the month of August, and the current price action behavior raises the chances to have a false thrust up above the current Weekly range. Taking out the Weekly High right at coming Monday is a bullish signal to reach the 6990 level, right into a strong resistance area, so that in terms of Daily and Weekly timeframes it can turn out to be a false breakup of the current Weekly range.
Another high probability scenario, is to get a weekly inside bar, as a Weekly correction down before the attempt to break up (by the first week of October), as described above.
As for the bearish side, there isn’t any point to look for bearish moves that are more than a Monthly correction down that most likely should respect the current Quarterly Low. Currently there isn’t even any sign of weakness and any indication to a bearish move. Best is to wait for a bullish activity on the top of the range to turn eventually into signs of weakness before taking any steps downward.
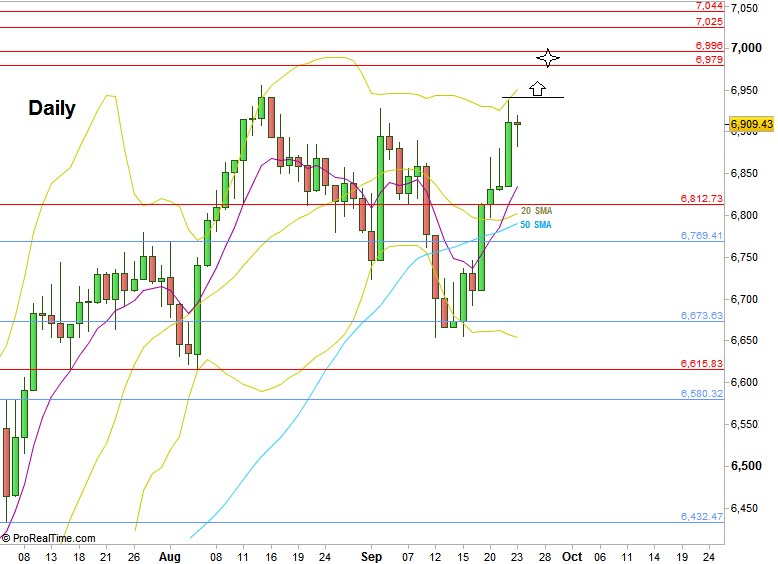
FTSE Futures, Daily chart with main support and resistance levels (at the courtesy of prorealtime.com)
Disclaimer: Anyone who takes action by this article does it at his own risk and understanding, and the writer won’t have any liability for any damages caused by this action.