
After the convincing bullish behavior at the week before, the passing week retraced to test back the 8 EMA, and to reverse back up in a way that cause the 8 EMA to bend and turn back upwards, a strong bullish behavior. Such an opportunity was recommended by the end of the last review.
The passing week closed finally as a bullish pinbar on sloping 8 EMA. A thrust up above the Weekly High is a setup to reach the same magnitude of this pinbar, in this case, the 7200 level, meaning also a penetration of the Quarterly upper Bollinger band. Pay attention that this is the same target as for the Quarterly bullish signal made by the pinbar of the 2nd Quarter 2016 and the last June Monthly bar (the Brexit month), as the market has already made a trust up above their Highs.
A closer target is the Engulfing pattern made by the Daily bar of last Thursday. A thrust up above its High has been made throughout last Friday, and the target for this setup is approximately 7095, right at the Weekly upper Bollinger band, a clear resistance area. I wouldn’t suggest to maximize this trade aiming at the 7200 target with the same Daily stop, as the 7095 level is a clear resistance area, and the market should most likely correct if/when this level is reached.
The major target above is the 7250 level, the target of the Weekly bullish follow through setup (see the Weekly chart). The Yearly bullish pinbar of year 2009 points to the next major target, at 7420. The Semiannual setup of the bullish pinbar on sloping 8 EMA points towards 7500 as its target, but that is more likely to happen by year 2017, as dealing with the Yearly bullish setup pointing towards the 8700 area.
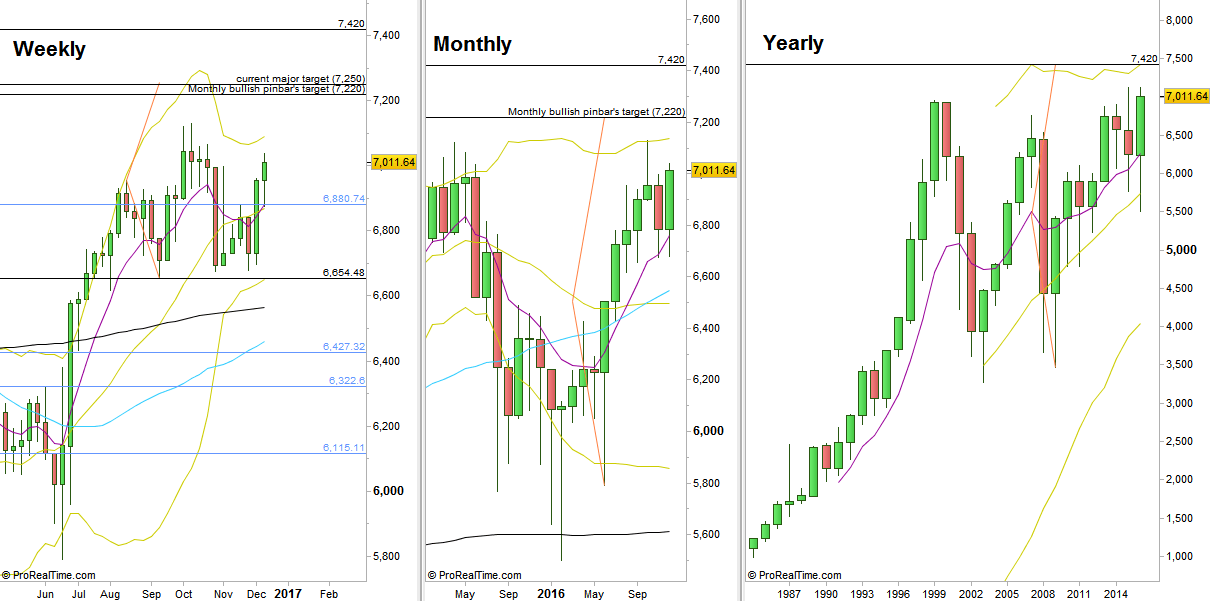
FTSE Futures, Weekly, Monthly and Yearly charts (at the courtesy of prorealtime.com)
Disclaimer: Anyone who takes action by this article does it at his own risk and understanding, and the writer won’t have any liability for any damages caused by this action.