
The passing week was another relatively narrow range inside Weekly bar, continuing the slow advance upwards.
The signs of strength for the near term are clear: the Weekly bar closed above the 8 EMA short term sentiment line, and the Daily bars showed no real weakness going through the down sloping Daily 20 SMA (mid Bollinger Bands), closing almost all Daily bars above the Daily 8 EMA line, a short term bullish picture.
There are very good chances to see the price reaching the Daily 50 SMA and the upper Bollinger band, currently at levels 6900-6920.
The Monthly bar is going to close at Wednesday, and signs of strength at the beginning of the week might cause the Monthly bar to close as a bullish pinbar on sloping 8 EMA. In that case a thrust up above the Monthly is a very good bullish signal to advance at least by the size of the Monthly bar, above the current target of the post Brexit bullish pinbar (June 2016), at 7220. It can be identical to the current bullish target of the Weekly follow through after taking out a major LHBL, at 7250. Notice that the latter setup is based on respecting the Low at 6654.48 (the stop level), below the level of 6654.48 it is a clear bearish sentiment for the midterm.
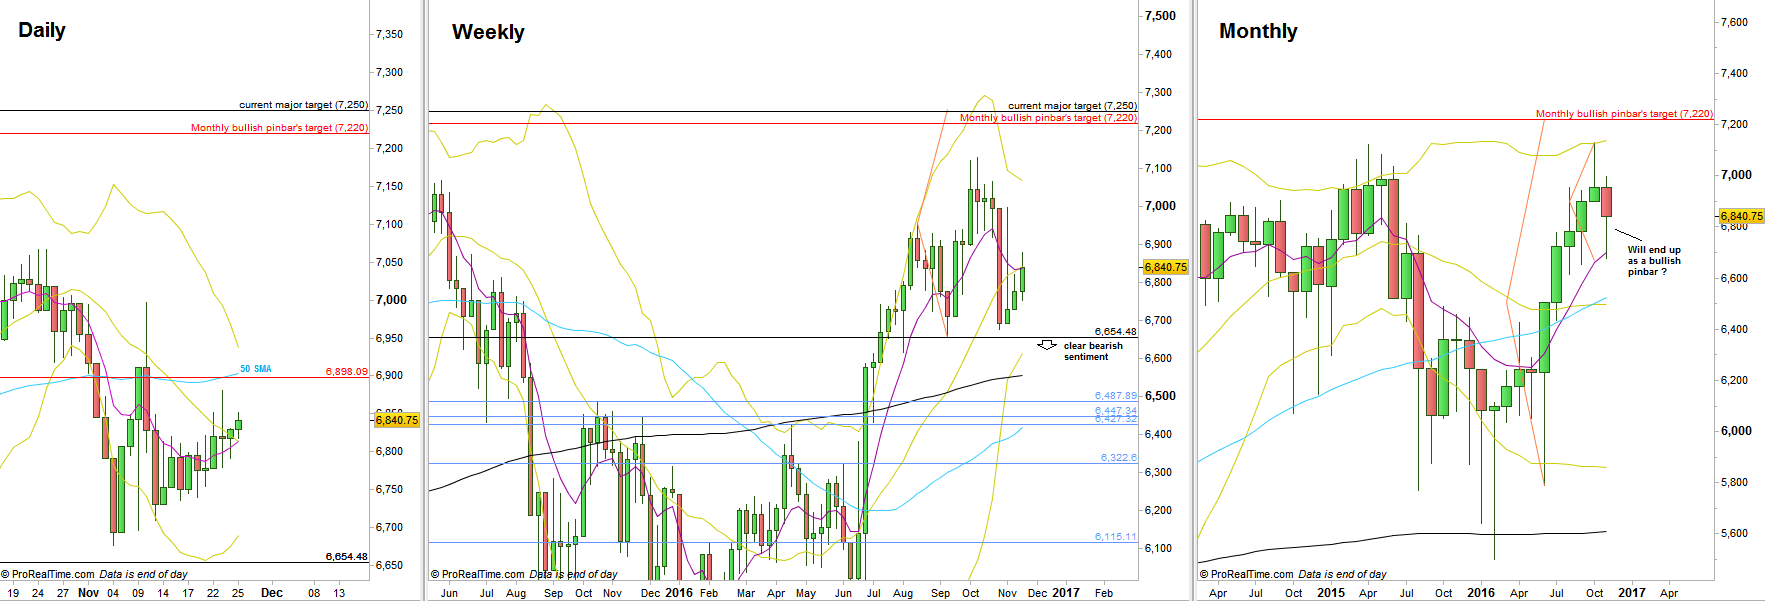
FTSE Futures, Daily, Weekly and Monthly charts (at the courtesy of prorealtime.com)
Disclaimer: Anyone who takes action by this article does it at his own risk and understanding, and the writer won’t have any liability for any damages caused by this action.