
The FTSE was the highest volatile index throughout the passing week among main stock indexes, where much of the credit belongs to the GBP.
The week started by taking out the previous week’s High and negating a Daily bearish setup mentioned in the last review, breaking up strongly all the resistance levels mentioned.
By taking out the previous Monthly High at 6955.34, a bullish signal to reach the level of 7250 at the Weekly upper Bollinger band has been triggered, stop below the Weekly swing Low at 6654.48.
It seems that nothing would stop it from making a new all time High, but pay attention that although the big bullish momentum, and that the price was so closed to take out the all time High, it stalled in less than a point below the all time High (7122.74), and so far the reversal up on last Friday lacked a convincing thrust by the end, both are signs of weakness.
However, the Daily price action is above the steep 8 EMA short term sentiment line – pointing up, so shorting the market below the Low of Thursday at 6999.96 is not a good idea, and we need to see more signs of weakness prior to considering a Daily short position.
Taking out the Weekly High means by most chances making a new all time High and achieving the target of 7250 mentioned before. As for the swing, pay attention whether the Monthly upper Bollinger band at 7145.4 is being penetrated within the same Daily momentum, it might give a hint for the next price action development.
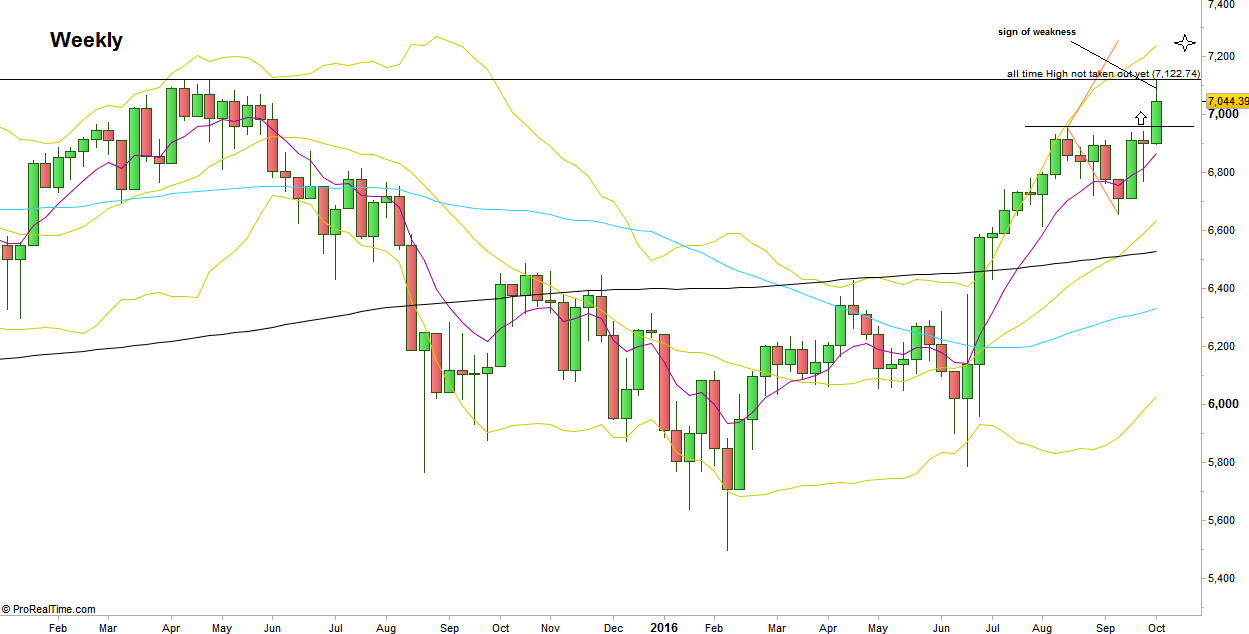
FTSE Futures, Weekly chart (at the courtesy of prorealtime.com)
Disclaimer: Anyone who takes action by this article does it at his own risk and understanding, and the writer won’t have any liability for any damages caused by this action.