
After the potential Daily bullish setup introduced here last week, the market did consolidate for one day, but instead of continuing the thrust up it has shown signs of weakness for most of the passing week.
So far, certainly before taking out the Weekly Low at 6723.21, – it is not bearish for the short term (Daily and above). We are still in the range of the previous Friday, which means also an inner Weekly bar. This Weekly bar closed slightly above the Weekly 8 EMA short term sentiment line, and the last Daily bar although reaching almost the 50 SMA, closed finally above, and above the support level of 6764.8 – all are signs of strength.
Taking out the Weekly Low at 6723.21 is a bearish setup to decline into the 6515 level, but as usual I wouldn’t recommend bucking the trend on the first signal. Certainly there will be a strong support at the area of 6650 to 6700, as the price has left this area sharply upward – the last time it had been there. So in this case it is wiser to wait for the buyers to appear in these levels, and seek other signs of weakness and a good bearish signal on the Daily/8H/4H – had the market bounced first.
As for bullish ideas, taking out the High of Friday September 2nd as suggested in the previous review is not a good bullish setup anymore. In this case the High of the Month at 6955.34 should be taken out, but not before one more trading week (i.e. the coming week). Otherwise, it might turn into a false thrust up on the Weekly and Monthly levels.
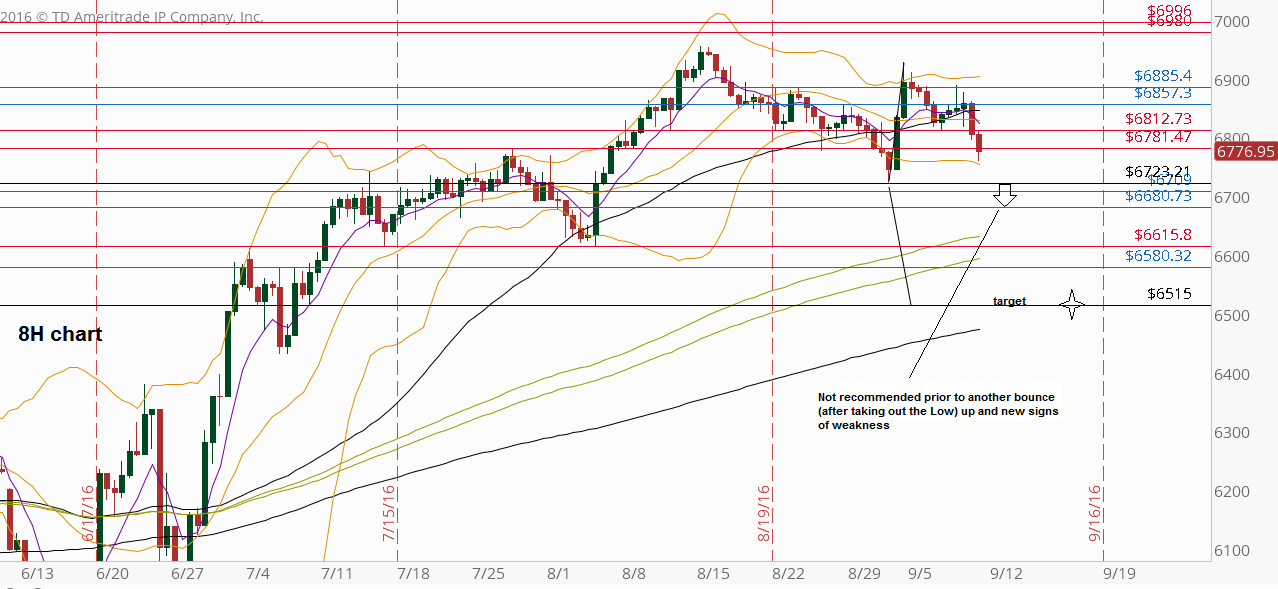
FTSE Futures, 8H chart with main support and resistance levels (at the courtesy of thinkorswim.com)
Disclaimer: Anyone who takes action by this article does it at his own risk and understanding, and the writer won’t have any liability for any damages caused by this action.