
Like other European indexes, the FTSE100 had a Daily correction throughout most of the passing week, and was rather weak than the American indexes. Pay attention to the negative correlation among stocks and currencies in the Euro zone, that became much significant lately (as opposed to this same kind of correlation in the US where for a considerable amount of time we see the stocks advancing with the USD mostly, i.e. positive correlation). From price action point of view, it is expected to see soon the GBP starting a big correction up, so if this negative correlation is being preserved, we are about to see soon more pressure on the FTSE downward.
The FTSE has reached the 6950 level again, which served as all time High for 15 years, almost reached the target of the Weekly bullish pinbar mentioned in the last review, at levels of very strong resistance, 6980 till 6996.
Currently there is a bearish setup to take out the Low of the Daily pinbar of 11-AUG-2016 down to the Daily 20 SMA. I would give less chances for this to succeed, since we are in a relatively strong momentum, so it is better to wait for a second bearish setup before bucking the trend.
On the other hand, taking out last Friday’s High, that may be followed by a small 4 Hour correction and then a follow through up is a bullish signal to test again at least the last swing High (levels 6925-6950), and would give much more chances to see the price climbing eventually higher towards the resistance mentioned above (6980-6996).
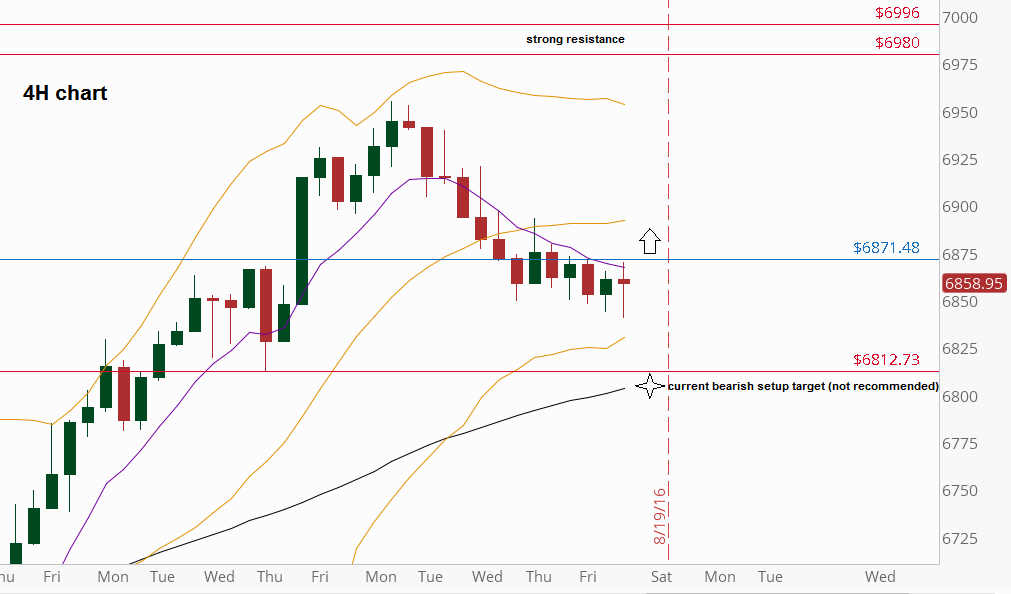
FTSE Futures, 4H chart (at the courtesy of thinkorswim.com)
Disclaimer: Anyone who takes action by this article does it at his own risk and understanding, and the writer won’t have any liability for any damages caused by this action.