
Another small range weekly bar has printed on the Weekly chart, but this time it was very meaningful though.
The fact that the price closed the Monthly chart above the important Monthly LLBH (Last Low Before High) discussed extensively in the last reviews, is an important sign of strength. Unless we see a Monthly contra bearish bar on August that engulfs July’s Monthly bar, we should currently assume that the market wants to make a second attempt to break up the 15 year huge range (above 6950) in which last time if has failed in doing so (February till Jun 2015 reached 7122 but ended as a false break eventually).
The Weekly timeframe shows a very strong bullish momentum. The passing week was the 5th bar that makes a HL and penetrating deeply the upper Bollinger band.
Currently we are in a Daily correction down, and the Daily bar of Friday closed as a bullish pinbar, above the sloping 8 EMA, testing the same Monthly LLBH line from above in a “Kiss and Go” manner. This is a clear sign of strength.
Taking out the Weekly high at 6780.05 is a very good bullish setup to take out the near Highs discussed in the last reviews, the 6764.82 and the 6813.41, while the target is above 6873.43. Stops below Friday’s Low at the 6691.13 (Unless we get a new Daily LL bar at the beginning of the coming Week) .
Since Friday closed with a clear sign of strength mentioned above, an aggressive bullish setup would be to Buy a thrust up above its High at 6740.47 with the same stop loss and the same target, a much better R/R ratio.
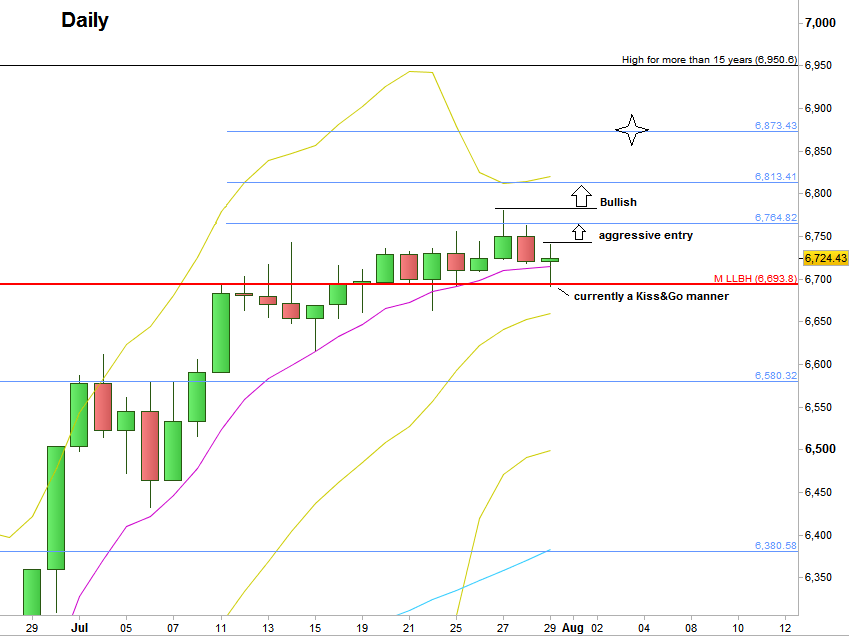
FTSE Futures, Daily chart (at the courtesy of prorealtime.com)
Disclaimer: Anyone who takes action by this article does it at his own risk and understanding, and the writer won’t have any liability for any damages caused by this action.