
After breaking up the 2 Week range in the previous week powerfully than expected, the passing week was no surprisingly a consolidation and testing again the 2 Week mid range, as this price action suggested two weeks ago.
The Monthly bar of May ended as a small range LH LL (Lower High-Lower Low) bar, in its upper side, but below the short term sentiment 8 EMA line, bearish.
The market is in a relative small range crossroads for the midterm.
Taking out the Low at 6109.58 is bearish. If the price continues down (maybe after a day or few days of correcting) and takes out the 6050.21 Weekly swing Low, then this is a bearish setup to reach the Weekly lower Bollinger Band around 5800.
If, on the other hand, the price goes up and takes out the Monthly high at 6290.07, best if it happens only towards the end of the coming week, it is a bullish setup to reach the highs at 6447.34 and 6459.46, not necessarily the high of 6487.89. This scenario might include a false break down of the Weekly Low at 6151.9 in the first half of the week ahead, that might attract too many bears. Again, as mentioned above, the bearish scenario has more odds to begin only when the price goes below the Low of 6109.58.
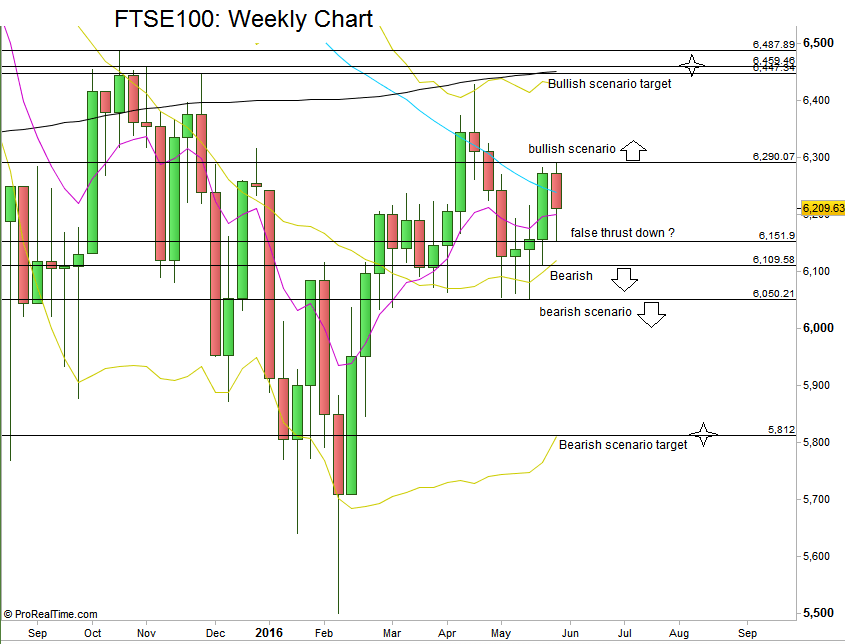
FTSE100: Weekly chart (at the courtesy of prorealtime.com)
Disclaimer: Anyone who takes action by this article does it at his own risk and understanding, and the writer won’t have any liability for any damages caused by this action.